|
(click on image for larger view)
|
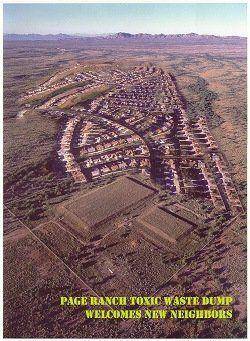
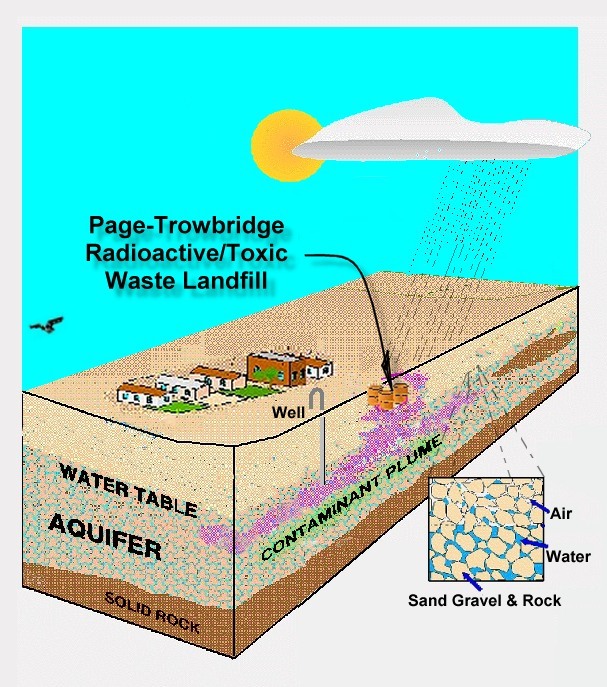
SaddleBrooke Ranch & Surrounding AreaThe purpose of this page is to allow interested persons to get an idea of the relationship between SaddleBrooke Ranch and its environment. Early maps of SaddleBrooke Ranch Planned Area Development (PAD) referred to the Page-Trowbridge radioactive/toxic waste landfill as an "experimental ranch". Current maps of the planned community do not mention the radioactive/toxic waste landfill at all. The web page containing the map by Robson Communities showing proposed land use for SaddleBrooke Ranch may be viewed by clicking HERE.
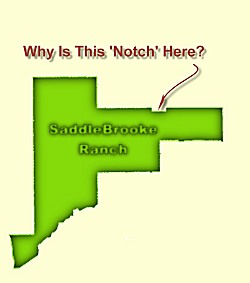
Most of the boundary lines delimiting SaddleBrooke Ranch do not appear unusual -- they follow straight lines or the lines of existing washes. However, on the top right
edge of the property there is a notch, which seems slightly unusual ---
why doesn't this boundary merely go in a straight line?
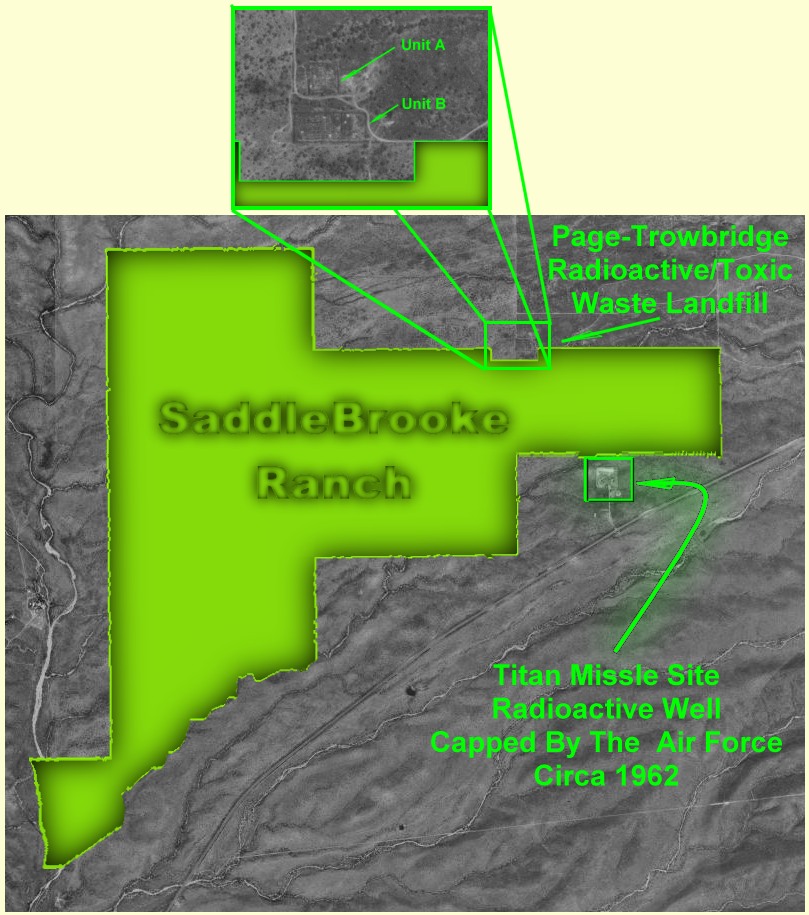
If a composite of couple of these images are made, we can obtain an aerial view of the area around SaddleBrooke Ranch and overlay our drawn copy of the SaddleBrook Ranch outline on that view. Inspection of the aerial view reveals:
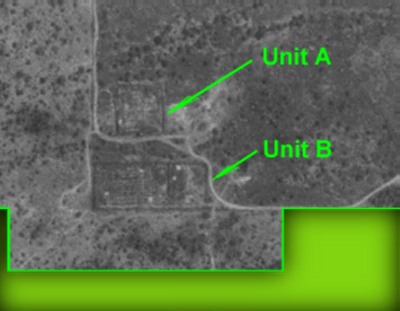
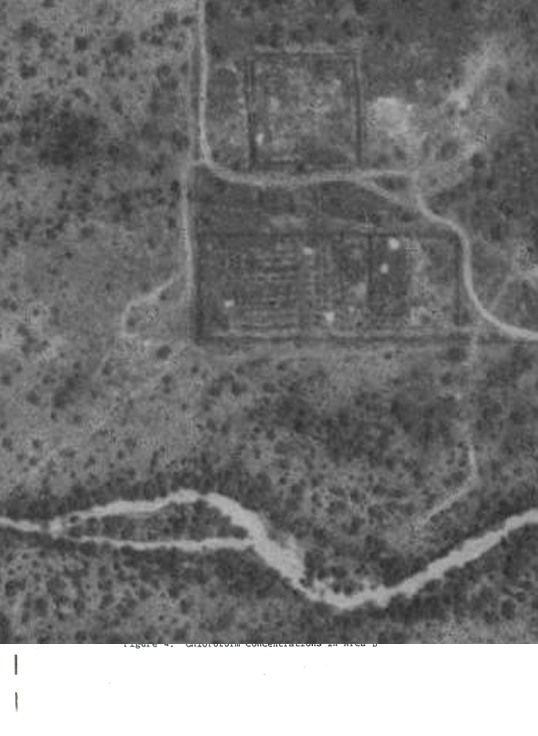
The image below shows a larger version of the area around the notch. Both units of the Page-Trowbridge radioactive/toxic waste landfill are visible in this image. The Terraserver image of the Page-Trowbridge radioactive/toxic waste landfill was taken on July 25th, 1995 before the caps were installed over Unit A and Unit B. The pox like lesions of raw land visible in both units are probably places where the vegetation had not yet grown over the holes dug into the earth and used to contain the radioactive and toxic waste that was poured into them several years earlier.
|
The Soil Gas Tests Of 1988
From the official report1
of these tests, we learn that a soil gas surveys are an excellent, cost
effective and commonly accepted means of detecting contaminants in groundwater
and/or soil (emphasis supplied):
Soil gas surveys consist of the sampling and analysis of the soil gases that resides in the pore space of the unsaturated zone above the water table. Because many of the common organic compounds and industrial solvents exhibit significant vapor pressures and are relatively insoluble in water, their introduction into subsurface soils results in vapor phase permeation and transport. Should these chemicals reach the water table and travel with the groundwater, vapors will continue to emanate from the contaminated groundwater into overlying soil. Thus, organic contamination of the subsurface or groundwater can be detected by measuring the concentration of volatile organics in the soil gas.
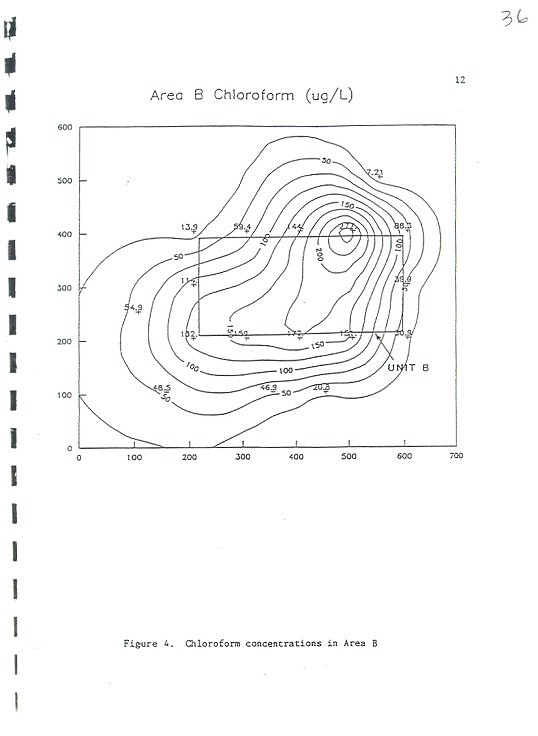
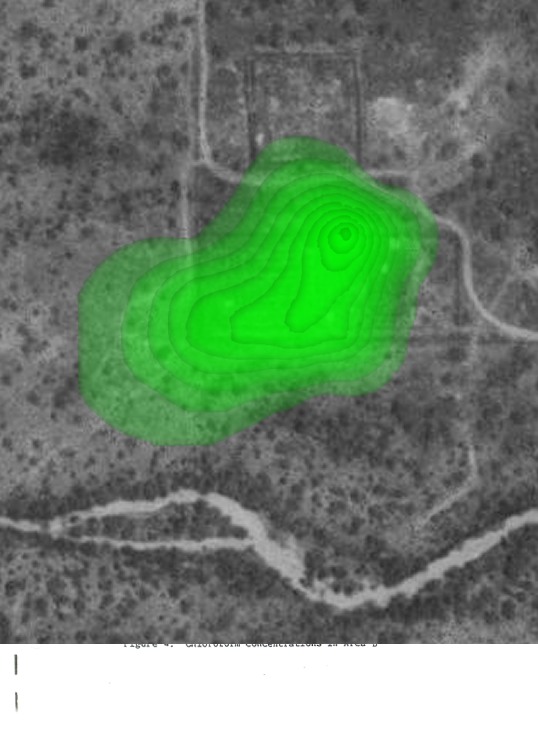
". . . environmentally important compounds found at high concentrations throughout the study area"The report also contains graphical figures showing the distribution of some of the compounds3: Several figures were prepared showing the distribution of those environmentally important compounds found at high concentrations throughout the study area. Figure 3 presents soil gas data for chloroform, found in the greatest abundance in samples collected around Unit A. Figure 4 shows the distribution of chloroform detected in high amounts in and around disposal Unit B. The Chloroform Chart
The outer rectangle represents the size of the charting area used, the inner rectangle represents the boundary of Unit (Area) B, and the topographical-like lines represent concentrations of chloroform as indicted by the soil gas tests. As can be seen by looking
at the chart, the hazardous compound chloroform was found 200 feet south
of the southern boundary of Area (Unit) B 12 years ago, in July of 1988).
Summary Of the 1988 Soil Gas Tests
References2: Ibid, page 1 3: Opcit, page 6 4: Ibid, page 15 |
News
& Information
Introduction
![]()
![]() email:mekazda@mindspring.com
email:mekazda@mindspring.com