| A closed meeting of water
experts organized by Oracle Residents Ann Woodin and Linda Leigh was held
at Biosphere II on March 13, 2001.
While the organizers claimed that the purpose of the meeting was "the opening of a discussion on water between professionals and the affected residents of the region," affected residents were not allowed to attend. The organizers did allow those excluded from the meeting to provide questions, however. The organizers implied that questions approved by the organizers would be put to the experts at the meeting. The following questions were submitted to and approved by the organizers of the meeting, but were never asked of the experts during the meeting. |
|
J.C. Huntington, March 12, 2001 A Model A model is required to provide context for the questions. The model used is motivated by the one presented by Montgomery and Anderson in their paper "Safe Yield" -- Concepts and Conflicts, and defines a groundwater basin in terms of recharge into it, discharge from it and the depth of the water beneath land surface. The model is represented schematically below:
|
|
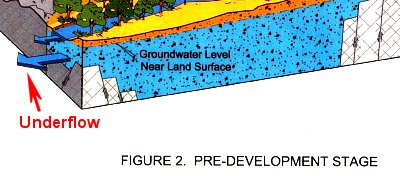
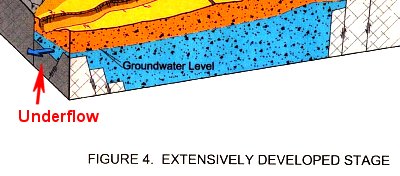
Underflow: A Key Component A key element in the model is underflow -- underflow is the underground flow of water from one groundwater basin to another. Underflow connects groundwater basins to form a system. The figure below shows a system of two groundwater basins connected by underflow. The underflow out of Groundwater Basin 1 flows into Groundwater basin 2
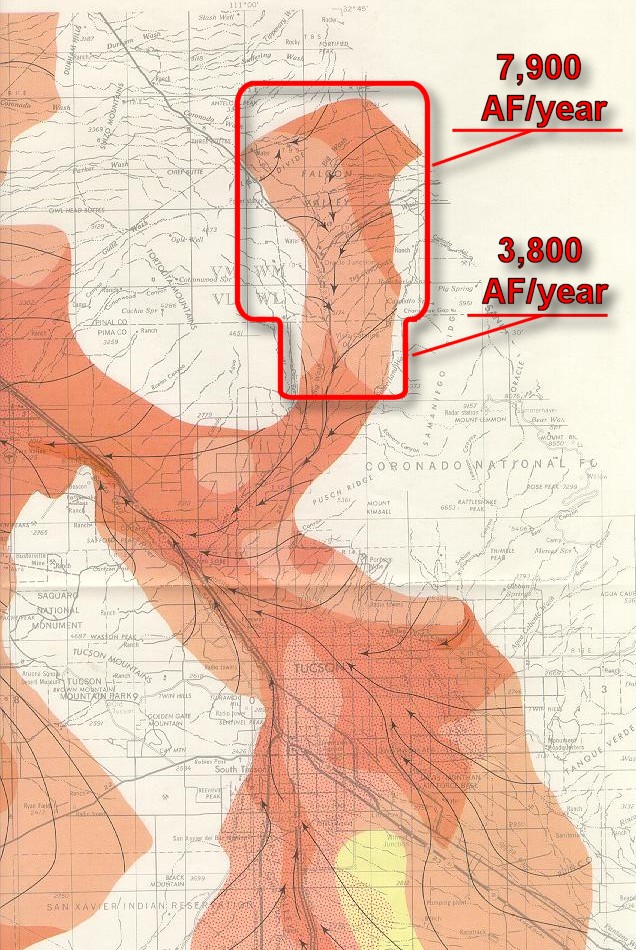
One reason it is important to consider a system of interconnected basins is because if the basins are interconnected, changes to a basin can effect the state of a connected basin(s). (E.g. if Groundwater Basin 1 is pumped dry, Groundwater Basin 2 would cease to get underflow from Basin 1). Another reason it is important to consider a system of interconnected basins is to get a complete understanding of the water supply for a region. Defining the Boundaries of the Regional Aquifer To facilitate communication, a fairly precise definition of the Regional Aquifer is required. The image below is a portion of a map from the Arizona Department of Water Resources and shows the aquifer in the Oracle Junction area south to the Tucson area. The arrows show the direction of groundwater flow and the colors indicate inferred velocity of the flow.
To facilitate communication we define the Regional Aquifer as having the boundaries shown below. This boundary corresponds to the one used by John McIver and described thusly in his Personal Report of November, 2000 (emphasis supplied): "The annual rate of groundwater recharge within the Pinal County portion of the study area has been estimated as being of the order of 7,900 acre feet per year and in the northern most 4 miles of Pima County as being in the range of 3,800 acre feet per year. .
For the purpose of this note, we use the the term "Big Wash sub-basin" (abbreviated as BWSB) to denote the regional aquifer described above. We note that underflow from the BWSB goes to the southsouthwest. [Note: the fact that boundaries of a sub-basin may be drawn somewhat arbitrarily, does not mean that the boundaries are insignificant. For example, had the southern boundary of the Big Wash sub-basin been drawn at Oracle Junction, the recharge rate into the sub-basin would be significantly less than the recharge rate associated with the boundary as shown. This arbitrary boundary of the Big Wash sub-basin (and the associated recharge rate), could have great significance to residents whose water is pumped from wells at or north of Oracle Junction.] Relationship Between Development, Depth to Water and Underflow Montgomery and Anderson assert that, in general, there is a relationship between development, the amount of stored water in a groundwater basin and the amount of underflow out of the basin. Specifically, as development increases more water is withdrawn from the basin. As a result, the water level drops and the amount of underflow to other basins is reduced. Figures in the Montgomery and Anderson paper "Safe Yield" -- Concepts and Conflicts illustrate:
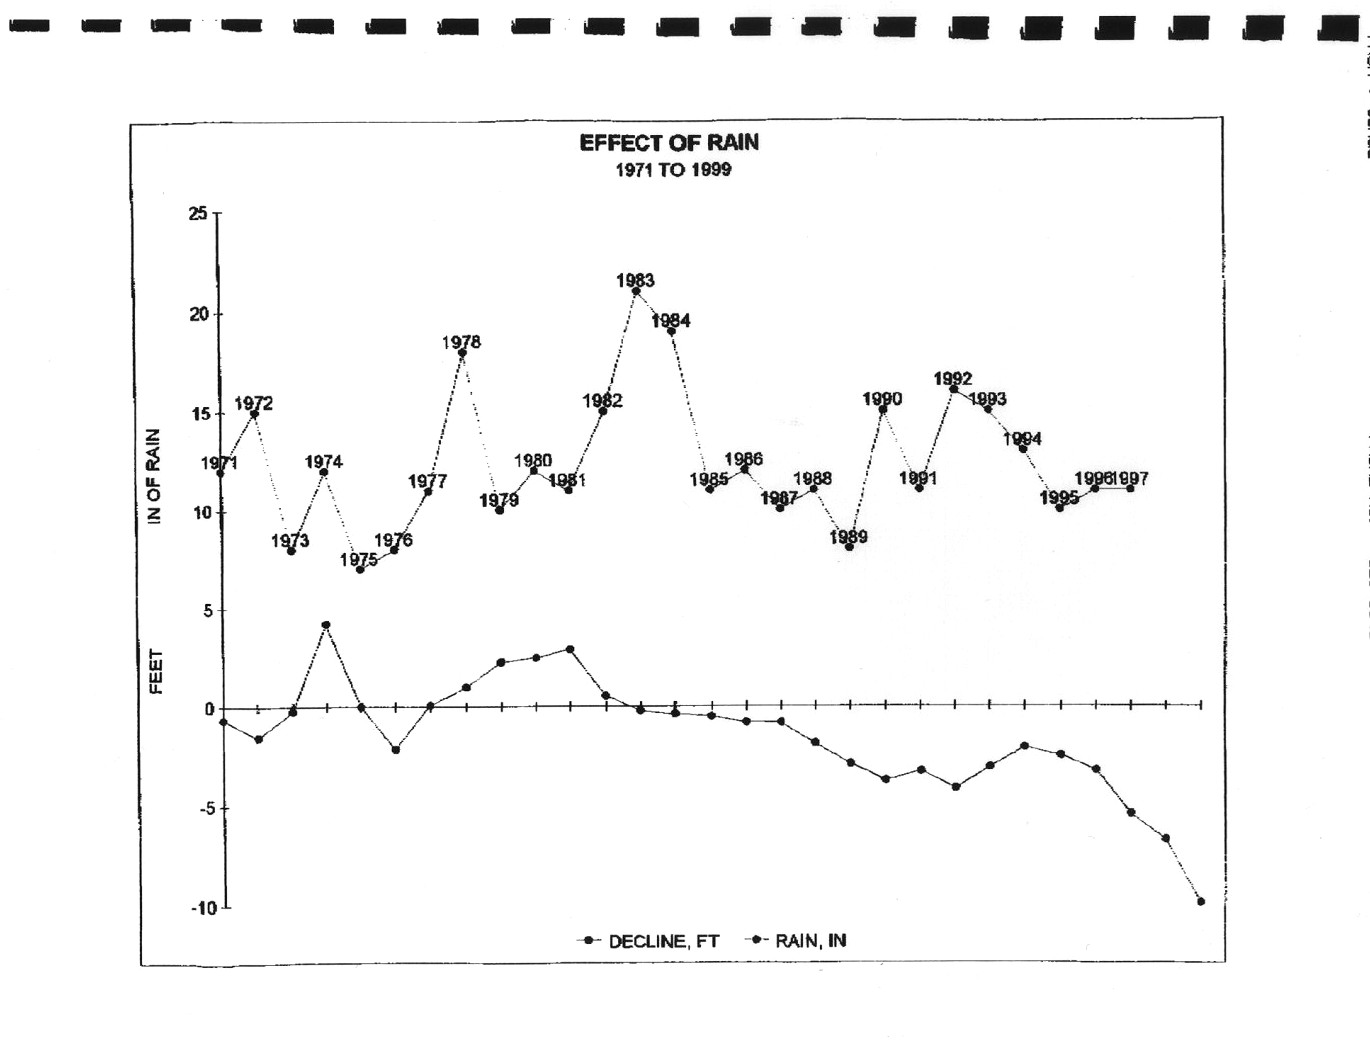
Declining Water Table In Oro Valley -- a Water Supply "Downstream" from BWSB Work by Conde has shown that the water table in Oro Valley, which is partially fed by underflow from the BWSB, is rapidly decreasing as population rapidly increases:
[Note: Conde has noted that
as the volume of water withdrawn from the aquifer increases, the less the
effect of rainfall on the water level. Note that the water level
for the Oro Valley water supply tracks rainfall, though with some delay,
up until the early 1980's. At this point development put a large
demand on the water supply and the relatively minuscule recharge from rainfall
is "drowned out" by this large demand].
|
|
|
McIver has found that the rate of mountain front recharge into the BWSB is 11,700 acre feet per year and estimated that existing and projected use rate would be 6,800 acre feet per year. When underflow out of the BWSB is not considered, the difference between the rates of recharge and projected use makes it appear as though there is a surplus of water in the BWSB. In other words, the model of the BWSB as an isolated system that takes in more than it discharges, can naturally lead to the conclusion that the BWSB is operating "in the black" with respect to water use. A crude schematic below illustrates. Recharge is represented by rain clouds; the BWSB is represented as a container1; use is represented by a spigot in the side of the container.
However, when underflow out of the BWSB is considered, it is seen that the the BWSB is not an isolated system at all, but instead, a component of a large system -- the BWSB is a component of the Tucson AMA system. Per the Arizona Department of Water Resources, in 1995 the Tucson AMA had total recharge of 71,197 acre feet (including CAP, effluent and incidental recharge) and a total usage of 301,88. This is an overdraft of 230,684 acre feet per year (i.e. 75,168,612,084 gallons per year)[1,2]. The figure below illustrates (underflow is represented as a pipe between the containers).
To get an idea of how large the overdraft is, we can compare it to the amount of excess water McIver implies is being supplied to the BWSB, with the 1995 overdraft on the Tucson AMA. Specifically, if we assume all of the supposed excess water in the BWSB drains towards and replenishes groundwater pumped from the basins to the south of BWSB, it would take 47 ½ years to make up for the single year of overdraft on the Tucson AMA that occurred in 1995. Here are the numbers: If we use McIver's numbers
for recharge into the BWSB and his number for the water pumped from the
BWSB, we find that the recharge rate exceeds the
withdrawal rate by 4,856 acre feet per year:
Per ADWR, the overdraft in the Tucson AMA in 1995 was 230,684 acre feet [1,2]. If we assume that all
of the 4,856 acre feet of excess groundwater drains to other basins
in the Tucson AMA, then it will take 47 ½ years of the BWSB draining
towards the other basins in the AMA to make up for the single year of overdraft
that occurred in 1995:
1: Note Well: the figure represents aquifers as containers of water. In reality, aquifers are not "underground lakes," but rather water between granules of rocks, gravel and sand. |
|
|
Basin Wide Balance The definition of safe yield is " . . . a groundwater management goal which attempts to achieve and thereafter maintain a long-term balance between the annual amount of groundwater withdrawn in an Active Management Area and the annual amount of natural and artificial recharge in the active management area."To help achieve safe yield, CAP water is used to "replace" water withdrawn from aquifers in an AMA. However, Basin Wide Balance allows water level declines in one portion of an AMA to be offset by recharging water in another part of the same AMA. Thus, water withdrawn from the BWSB can be replaced at another part of the Tucson AMA -- say at the Avra Valley some 25 miles southwest (as the crow flies) from the BWSB. Hydraulically speaking, the Avra Valley is over 35 miles from the BWSB (as the aquifer flows). Moreover, the flow of the aquifer at Avra Valley is away from the BWSB (because the BWSB is uphill from Avra Valley). So, if CAP water is used to "replace" water withdrawn from BWSB, the "replacement" water will never make it uphill to the BWSB. Schematically:
|
|
The following set of questions are directed towards any representative of a proposed development that is planning to use water from the BWSB:
|
|
1:ADWR Third Management
Plan 2000-2010, Chapter 3, page 3-2
|